The Results

We recently undertook an experiment looking into interior air quality within cars owned by eight members of staff here at Redmore Environmental. The results are now in and we’ve been spending some time considering the data alongside a number of factors that may have influenced the findings.
The Interior Air Quality Results
After a month of monitoring, there was one clear winner with an average nitrogen dioxide (NO2) concentration of 7.22µg/m3. The vehicle in last place had an average concentration of over double this value at 17.42µg/m3. Although there is a considerable difference between the highest and lowest concentrations, it is worth noting that all results are significantly below the annual mean NO2 air quality objective of 40µg/m3.
The Table below shows the measured NO2 concentration and total miles driven for each car, highlighting the lowest and highest values.
Table 1 Average NO2 Concentration (µg/m3)
| Vehicle | A | B | C | D | E | F | G | H |
| NO2 Concentration (µg/m3) | 9.15 | 7.22 | 9.51 | 15.84 | 17.42 | 12.64 | 12.64 | 9.01 |
| Total Miles Driven (miles) | 291 | 2,727 | 328 | 948 | 1,593 | 1,314 | 1,573 | 767 |
The Analysis
Several factors were considered as part of the analysis. These included:
- Total miles driven;
- The age of the vehicle; and,
- The average background NO2 concentration where the vehicle is kept (obtained from the Department for Environment Food and Rural Affair’s background maps tool).
The chart below provides a graphical representation of the average NO2 concentration for each car and the values for the various factors that have been considered.
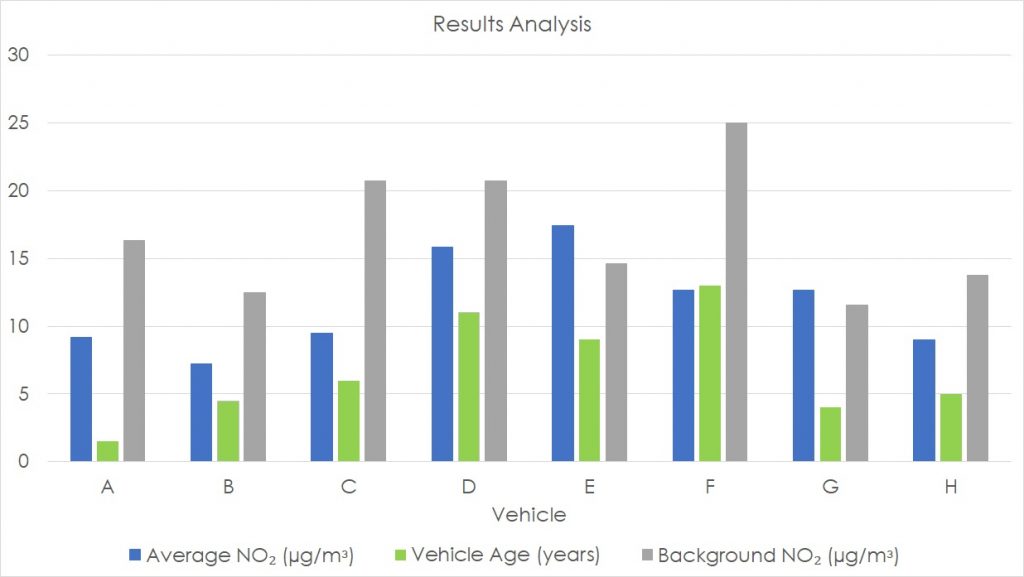
Based on the data shown in the graph and table above, the following conclusions have been drawn on interior air quality:
- The age of the vehicle appears to have an effect on NO2 concentrations, with newer vehicles generally recording lower levels. This may be indicative of more recent improvements to filtration systems which help to reduce the potential for ingress of pollutants;
- No relationship was found between the number of miles driven and internal concentrations of NO2. Vehicle B drove the furthest and had the lowest recorded levels of NO2; and,
- No relationship was found between the background NO2 levels and concentrations within vehicles. The background concentration for Cars C and D was the same yet measured NO2 levels were considerably different.
These results are based on one month of monitoring and have been collected to provide an insight into the potential for exposure to pollution within our own vehicles. Our analysis has highlighted a number of areas of interest, in particular the impact of older vehicles on their users and the environment. Although, as mentioned previously, the recorded concentrations within each vehicle were below the annual mean criteria, the results have helped us to improve our understanding of exposure to pollutants whilst driving and as a consequence I’m sure we’ll all be considering cycling to work more often!
If you’re concerned about air quality in your neighbourhood, or would like to discuss the results of our experiment in more detail, then please get in touch with us today.
Contact Us
Please use the contact form below to get in touch and we’ll get back to you as soon as we can
